


Top 7 Funnel Metrics for SaaS Apps
- Customer Acquisition Cost (CAC): Measures how much you spend to acquire a paying customer. Formula: Total Marketing & Sales Costs ÷ New Customers Acquired. Aim for a CAC Payback Period under 12 months and an LTV-to-CAC ratio of at least 3:1.
- Customer Lifetime Value (LTV): Tracks the revenue a customer generates over their relationship with your business. Formula: ARPU × Average Customer Lifetime. A healthy LTV-to-CAC ratio is 3:1 or higher.
- Conversion Rate: The percentage of leads or visitors who take the desired action. Break it down by funnel stage (e.g., trial to paid customer). SaaS benchmarks: 3%–10% overall.
- Monthly Recurring Revenue (MRR): Consistent monthly income from subscriptions. MRR categories include New, Expansion, Reactivation, Contraction, and Churn MRR. Growth-stage SaaS companies aim for 10%–20% net MRR growth.
- Churn Rate: The percentage of customers or revenue lost over time. Keep monthly churn under 5% and aim for negative net churn by offsetting losses with upsells.
- Time to First Value (TTFV): Tracks how quickly users experience their first "aha moment." Reducing TTFV can improve retention and trial-to-paid conversions significantly.
- CAC Payback Period: Measures how long it takes to recover acquisition costs. Formula: Sales & Marketing Expenses ÷ (Net New MRR × Gross Margin %). SaaS companies target a payback period of 2–9 months.
Why These Metrics Matter
These metrics work together to help SaaS businesses identify bottlenecks, improve customer retention, and drive sustainable growth. For example, balancing CAC with LTV ensures profitability, while reducing churn and TTFV boosts long-term revenue.
Pro Tip: Segment these metrics by customer type or acquisition channel for deeper insights. Start small, track consistently, and act on the data to refine your strategy.
7 Essential SaaS Funnel Metrics: Benchmarks and Business Impact
1. Customer Acquisition Cost (CAC)
Definition and Purpose of the Metric
Customer Acquisition Cost (CAC) measures the total cost of acquiring a single paying customer. This includes everything - ad spend, content creation, sales salaries, commissions, and even software expenses [9][13].
Lior Ronen, Founder of Finro Financial Consulting, explains:
"CAC determines whether growth creates value or burns cash. When calculated accurately and tracked over time, it shapes revenue, unit economics, headcount, runway, and fundraising strategy." [9]
In simple terms, CAC shows whether your growth is sustainable or fueled by excessive spending [9]. Investors pay close attention to this metric because a company with efficient acquisition costs is far more attractive than one with high revenue but unsustainable spending habits [9][12].
How to Calculate CAC
Understanding how to calculate CAC is essential. The formula is straightforward: Total Marketing & Sales Expenses ÷ Number of New Customers Acquired [7][12][14]. But to get accurate results, you need to include all relevant costs - not just ad spend. That means factoring in salaries, software tools, agency fees, and overhead [9][13]. Ignoring these can create misleading financial models [9].
Rick Faulk, CEO of Intronis, advises:
"By measuring and analyzing the strongest and weakest points in your sales and marketing processes, you can very easily scale back on the activities that are not yielding results and fuel additional resources behind the ones that are working." [11]
Proper calculation of CAC lays the groundwork for evaluating its impact on your business.
Typical Benchmarks and Ranges
For B2B SaaS companies, the average CAC hovers around $702 [15]. However, the more critical metric is your LTV to CAC ratio. The industry standard is 3:1 or higher, meaning the lifetime value of a customer should be at least three times what you spent to acquire them [7][9][10][12]. Many successful companies achieve ratios between 3:1 and 5:1 [15].
Another key benchmark is the CAC Payback Period, which measures how long it takes to recover your acquisition costs through subscription revenue. Most SaaS startups aim for a payback period of 5 to 12 months [12][13]. Top-performing enterprise-focused businesses often hit a 9-month payback [17].
CAC's Role in Business Growth and Revenue
CAC plays a pivotal role in shaping pricing strategies, hiring plans, and fundraising efforts. If your CAC exceeds your customer’s lifetime value (LTV) - for instance, spending $1,200 to acquire a customer who only generates $1,000 - you’re essentially burning cash and shortening your financial runway [9]. This scenario highlights why tracking CAC trends over time is far more insightful than relying on a single static number.
As businesses grow, CAC tends to increase. Early, low-cost leads eventually dwindle, competition heats up, and affordable marketing channels become saturated [9]. To combat this, many SaaS companies turn to Product-Led Growth strategies to keep acquisition costs in check [9][12]. Segmenting CAC by channel - like comparing PPC campaigns to organic traffic - can also uncover which efforts are driving real profitability [11].
sbb-itb-c336128
2. Customer Lifetime Value (LTV)
Definition and Purpose of the Metric
Customer Lifetime Value (LTV) measures the total revenue a customer is expected to bring in over their entire relationship with your business. While Customer Acquisition Cost (CAC) focuses on how much it costs to gain a customer, LTV looks at the long-term revenue they generate. For SaaS companies, which often rely on recurring revenue, this metric is crucial. It ensures that the income from a customer outweighs the cost of acquiring them. As Luke Marshall, CEO of Baremetrics, explains:
"LTV really is the representation of what is keeping the business going, i.e. how much money you're getting over time" [21].
Calculation Method or Formula
There are a few ways to calculate LTV, but the most common formula is:
LTV = ARPU × Average Customer Lifetime
Alternatively, you can use:
LTV = ARPU ÷ User Churn Rate
For a more accurate picture, you can adjust for gross margin:
LTV = (ARPU × Gross Margin %) ÷ Revenue Churn Rate
To account for potential future churn variations, some businesses apply a 0.75 multiplier to this formula [18] [19] [20].
Typical Benchmarks and Ranges
In the SaaS world, a healthy LTV-to-CAC ratio is typically at least 3:1. Ideally, this ratio falls between 3:1 and 5:1 [18] [19] [22]. A ratio below 3:1 suggests acquisition costs are too high, while a ratio above 5:1 might indicate you're not investing enough in growth [19].
Impact on Business Growth and Revenue
A strong LTV allows businesses to spend more on acquiring customers without sacrificing profitability. By segmenting LTV by pricing tiers or acquisition channels, companies can pinpoint their most valuable customer groups [18] [21]. For instance, lower-priced plans often experience higher churn rates compared to enterprise-level plans [18] [21]. Strategies like reducing churn and focusing on upselling can significantly improve LTV. Even a small 5% decrease in churn can greatly enhance profitability [12] [18] [19].
3. Conversion Rate
Definition and Purpose of the Metric
Conversion rate is the percentage of visitors or leads who take a desired action at any stage of your funnel. For SaaS companies, this usually means tracking how many website visitors turn into free trial users, progressing through multiple stages [23]. Unlike straightforward e-commerce purchases, SaaS conversions often involve a series of steps leading to a recurring financial commitment [23].
This metric helps you pinpoint where potential customers drop off and identify which strategies effectively drive revenue [1][8]. It directly influences your Monthly Recurring Revenue (MRR) and determines whether your Customer Acquisition Costs (CAC) are sustainable [1][23]. Here’s a sobering statistic: sales teams miss conversion goals by over 37% due to inefficiencies at the top of the funnel. On top of that, only 26% of businesses successfully track the customer journey from the first touchpoint to the final purchase, highlighting serious gaps in conversion tracking [24][3].
Calculation Method or Formula
The formula is simple: Conversion Rate = (Total Conversions / Total Leads) × 100 [1][6]. However, for SaaS, it’s crucial to break this down by funnel stage. Track conversions from website visitor to free trial, free trial to Product-Qualified Lead (PQL), and PQL to paying customer [23]. Each stage offers unique insights into your funnel’s performance. Mastering these calculations is essential for benchmarking your results against industry standards.
Typical Benchmarks and Ranges
| Funnel Stage | Typical Benchmark |
|---|---|
| Website Visitor to Free Trial | 8.5% [23] |
| Free Trial to PQL | 4% [23] |
| PQL to Paying Customer | 20%–40% [23] |
| Small Business SaaS (Overall) | 6%–10% [1] |
| Medium Business SaaS (Overall) | 3%–5% [1] |
Take this example: Between 2023 and 2025, Flos USA, a lighting retailer, used VWO to refine their funnel. By simplifying color options on product pages, they boosted add-to-cart actions by 19.35%. This tweak led to a 125% increase in checkout conversions and delivered an impressive 18X return on investment [3].
Impact on Business Growth and Revenue
Even small gains in conversion rates can drive massive revenue growth. If your Free Trial to PQL rate is under the 4% benchmark, it might signal issues with onboarding or unclear value communication [23]. To address this, personalize the onboarding experience based on user goals (often identified through the "Jobs To Be Done" framework during signup) [23]. Use in-app checklists to guide new users toward their first "Aha" moment, or try reverse trials - offering temporary access to premium features before prompting an upgrade [23].
Even minor adjustments can make a difference. For instance, adding extra fields to a signup form can reduce completion rates by as much as 13% per field [3]. Small tweaks, when strategically applied, can have a big impact on your bottom line.
4. Monthly Recurring Revenue (MRR)
Definition and Purpose of the Metric
Monthly Recurring Revenue (MRR) represents the consistent income a business earns each month from active subscriptions. Unlike one-off sales that create unpredictable revenue spikes, MRR provides a steady cash flow, making it easier to forecast earnings and plan strategically. Neil Patel, Co-Founder of NP Digital, highlights its importance:
"Monthly recurring revenue is the single most important metric that a SaaS business should be tracking" [26].
MRR simplifies comparisons across subscription terms - whether monthly, quarterly, or annual - by converting all payments into a monthly figure. This consistency helps businesses assess performance across their entire customer base and track financial progress. It's worth noting that MRR excludes one-time fees, professional services, and variable usage charges unless these are recurring by contract. This makes MRR a reliable indicator of product-market fit and the financial health of a subscription-based model.
Calculation Method or Formula
The formula for MRR is straightforward:
MRR = Total Number of Customers × Average Revenue Per User (ARPU)
For annual plans, divide the total contract value by 12 to determine the monthly revenue. For example, a $1,200 annual subscription translates to $100 in MRR.
Breaking MRR into categories provides deeper insights:
- New MRR: Revenue from newly acquired customers.
- Expansion MRR: Additional revenue from upgrades or add-ons.
- Reactivation MRR: Revenue from customers who return after previously canceling.
- Contraction MRR: Revenue lost when customers downgrade their plans.
- Churn MRR: Revenue lost due to cancellations.
To calculate your Net New MRR, use this formula:
Net New MRR = (New MRR + Expansion MRR + Reactivation MRR) – (Churn MRR + Contraction MRR)
Remember to account for any discounts or coupons to ensure accuracy.
Typical Benchmarks and Ranges
Benchmarks can help you evaluate your MRR's health and growth potential. For growing SaaS companies, a net MRR growth rate of 10%–20% is common, while high-growth businesses often generate at least 30% of their revenue from expansion [25][28]. On the flip side, a revenue churn rate between 0% and 5% signals stability, but a churn rate above 10% could indicate trouble [22][7].
The Quick Ratio is another useful metric. It’s calculated by dividing the sum of New and Expansion MRR by the combined total of Churned and Contraction MRR. A ratio above 1.1 suggests positive growth, while a range of 1.3 to 4.0 indicates very strong performance [27]. Additionally, since acquiring new customers can cost up to five times more than retaining existing ones, focusing on MRR retention is not just smart - it's essential for profitability [25].
Impact on Business Growth and Revenue
MRR plays a central role in shaping business strategy and fueling growth. Joel Gascoigne, CEO of Buffer, underscores its importance:
"I'm always looking at MRR. At the end of the day, that's our revenue and drives a lot of other strategic decisions such as hiring and other spend" [29].
MRR serves as a foundation for forecasting revenue, planning team expansion, and guiding product development. If your Expansion MRR falls below the 30% benchmark, it might be time to focus on upselling and cross-selling to your current customers - approaches that are often more cost-effective than acquiring new ones [28]. Conversely, a rise in Contraction MRR could signal that higher-tier plans aren’t delivering enough value for customers. By carefully tracking each MRR category, you can identify whether your growth is driven by acquiring new customers or strengthening relationships with existing ones.
5. Churn Rate
Definition and Purpose of the Metric
Churn rate tracks the percentage of customers or revenue a business loses within a specific period. For SaaS companies, this metric serves as a key indicator of health, showing whether your product is keeping customers engaged or driving them away. As Rami El-Abidin, a former HubSpot Support Rep, aptly said:
"Customer churn is like death and taxes: inevitable. The key isn't to eliminate it, it's to understand why it's happening" [35].
Churn can be broken into two types: customer churn, which measures the number of accounts lost, and revenue churn, which looks at the financial impact of those losses. Revenue churn is especially important for high-value customers, as it highlights the difference between gross churn (total revenue lost) and net churn (revenue lost after considering upsells or expansions). The ultimate goal? Achieving negative churn, where the additional revenue from existing customers outweighs losses from cancellations. This milestone reflects that customers are increasing their usage, fueling consistent revenue growth [30][25].
Calculation Method or Formula
Here are the formulas to calculate churn:
-
Customer Churn Rate:
(Lost Customers in Period / Total Customers at Start of Period) × 100 -
Revenue Churn Rate:
(Recurring Revenue Lost in Period / Recurring Revenue at Start of Period) × 100
For companies experiencing rapid growth, it’s better to use the average number of customers during the period instead of the starting count to avoid skewed results [32].
To calculate Net Revenue Churn, include expansion revenue in the equation:
[(MRR Lost - Expansion MRR) / MRR at Start of Period] × 100. A negative net churn rate indicates that your expansion revenue is more than compensating for losses, which is often seen as the gold standard for SaaS success [34].
Typical Benchmarks and Ranges
Churn, even in small amounts, can compound significantly over time. For instance, a monthly churn rate of 5% results in a 46% annual loss, while 10% monthly churn skyrockets to 72% annually [34].
For established SaaS companies, a healthy annual churn rate generally falls between 5% and 7% [1][22]. Monthly churn benchmarks differ based on the company's stage:
- Early-stage companies (under $300K ARR): ~6.5%
- Growth-stage companies ($1M-$3M ARR): ~3.7%
- Large-scale companies ($15M+ ARR): ~1.8% net MRR churn [34].
Contract terms also play a big role. Businesses with annual contracts often experience lower churn (8.5% annually) compared to those with month-to-month agreements (16%) [34]. Neil Patel, Co-Founder of NP Digital, cautions:
"If you have a high churn (double digits) for your SaaS business, there's something fundamentally wrong with your product" [26].
Additionally, if more than 15% of customers leave after the first month, it’s a clear sign that your onboarding process needs immediate attention [34].
Impact on Business Growth and Revenue
High churn creates a constant need to replace lost customers, which is costly and unsustainable. Acquiring new customers can cost 5 to 25 times more than retaining existing ones, making high churn a serious drag on growth [25][33]. Alarmingly, only 1 in 26 unhappy customers will voice their dissatisfaction before canceling [34].
The upside? Even a small improvement in retention - just 5% - can increase profits by 25% to 95% [31]. This is why nearly half (46%) of SaaS companies now rely on AI-driven churn prediction models to identify at-risk customers 60 to 90 days before they leave [34].
To address churn effectively:
- Reduce involuntary churn caused by payment failures by implementing dunning management systems.
- Conduct exit surveys to uncover whether cancellations stem from pricing, product limitations, or poor onboarding [31][33].
6. Time to First Value (TTFV)
Definition and Purpose of the Metric
Time to First Value (TTFV) tracks the time it takes for a user to go from signing up for your product to experiencing their first "aha moment" - that point where they solve a problem or see tangible benefits. This metric focuses on the moment users feel the product delivers real value.
It’s important to distinguish between completing onboarding steps and achieving actual value. For instance, in a project management tool, TTFV might be when a user successfully completes their first task. For an analytics platform, it could be when they generate their first meaningful report [36].
TTFV plays a crucial role in determining whether trial users convert into paying customers and stick around long enough to become loyal advocates. The quicker users experience value, the more likely they are to view your product as a necessity rather than just a nice-to-have. In this way, TTFV is as important as other key funnel metrics in driving conversions.
Typical Benchmarks and Ranges
Here’s a sobering stat: 74% of customers will leave if onboarding feels too complex [36]. That’s nearly three out of four potential users lost simply because they couldn’t reach value quickly.
Companies that achieve TTFV within 24 hours see impressive results, including an 18% increase in Net Revenue Retention and a 21% rise in Customer Lifetime Value [36].
For leading Product-Led Growth companies, activation rates - representing the percentage of users who hit their value moment - typically fall between 20% and 40% [1][4]. If your activation rate is below this range, it’s a signal that your onboarding process needs a closer look.
Impact on Business Growth and Revenue
Optimizing TTFV can create a ripple effect that benefits your entire business. For example, shortening TTFV by 30% can boost trial-to-paid conversions by up to 15% [36]. Interactive onboarding experiences that guide users directly to key features are a proven way to cut TTFV by the same 30% [36].
Retention also improves significantly when you analyze TTFV by user segments. Companies that track how different personas or industries experience time to value report up to a 20% improvement in retention rates [36]. After all, what a marketing manager considers valuable will differ from what a data analyst values, even within the same product.
To improve TTFV, start by identifying your product’s specific value moment, then streamline the path to get there. Use interactive tours that focus on guiding users to that moment rather than showcasing every feature. Break the onboarding journey into smaller, achievable milestones with clear progress indicators. Finally, tailor onboarding paths to match user roles, allowing them to skip irrelevant features and reach their value moment faster [36].
7. CAC Payback Period
Definition and Purpose of the Metric
The CAC Payback Period zeroes in on how quickly your business can recover the money spent acquiring a customer. In simple terms, it measures the number of months needed to recoup your customer acquisition costs. Unlike the LTV:CAC ratio, which focuses on long-term profitability, this metric emphasizes short-term cash flow - a critical factor for startups trying to stay afloat [37][17].
"Managing (or failing to manage) CAC payback can quite literally make or break your company." - Sean Fanning, Vice President, OpenView [37]
This metric is a key indicator of how efficiently your go-to-market strategy is performing. It highlights cash flow issues that might not show up in other metrics. For instance, even with an impressive 50:1 LTV:CAC ratio, a two-year payback period could spell trouble if your business lacks the cash reserves to survive that long [17].
Calculation Method or Formula
To calculate CAC Payback accurately, you need to incorporate your gross margin into the formula:
CAC Payback = Sales & Marketing Expenses / (Net New MRR × Gross Margin %) [37][16]
Here’s how to break it down:
- Net New MRR: This includes revenue from new customers, expansion revenue from existing customers, minus any churned MRR.
- Gross Margin: Factor in all costs of goods sold, such as hosting expenses (e.g., AWS) and customer success costs tied to onboarding [37].
For businesses with a sales cycle longer than three months, you can adjust sales and marketing expenses to align with the revenue generated over that cycle [37]. Using this approach provides a clearer picture of cash flow and helps identify realistic benchmark targets for SaaS startups.
Typical Benchmarks or Ranges
In the SaaS world, a payback period under 12 months is generally considered healthy [37][16]. Top-performing companies aim for 2–9 months, while most profitable SaaS businesses fall within the 9–14 month range [17]. Among enterprise-focused SaaS companies, the majority maintain a 9-month payback period [17].
Usage-based pricing models tend to shorten the CAC payback period by about 30% compared to traditional pricing structures [37]. Similarly, product-led growth models often achieve faster payback because they rely on the product itself to drive user acquisition, cutting down on hefty sales and marketing costs [37].
Impact on Business Growth and Revenue
A shorter CAC Payback Period allows businesses to reinvest in customer acquisition more quickly. On the flip side, payback periods exceeding 14–18 months can create cash flow challenges and elevate the risk of insolvency - especially if customers churn before reaching the break-even point [37][16].
"Retention is the best and only check on whether your implied CAC payback will ever be realized CAC payback." - Sean Fanning, Vice President, OpenView [37]
Retention plays a crucial role in this metric. For example, a six-month payback period is meaningless if customers churn at month three, leaving acquisition costs unrecovered [37]. To improve your payback period, you might explore strategies like tweaking pricing tiers or offering annual upfront billing instead of monthly payments. Annual billing gives you immediate cash flow, making it easier to recover CAC quickly rather than waiting for monthly installments [37][12].
11 essential SaaS metrics explained in 11 minutes
Metric Comparison Table
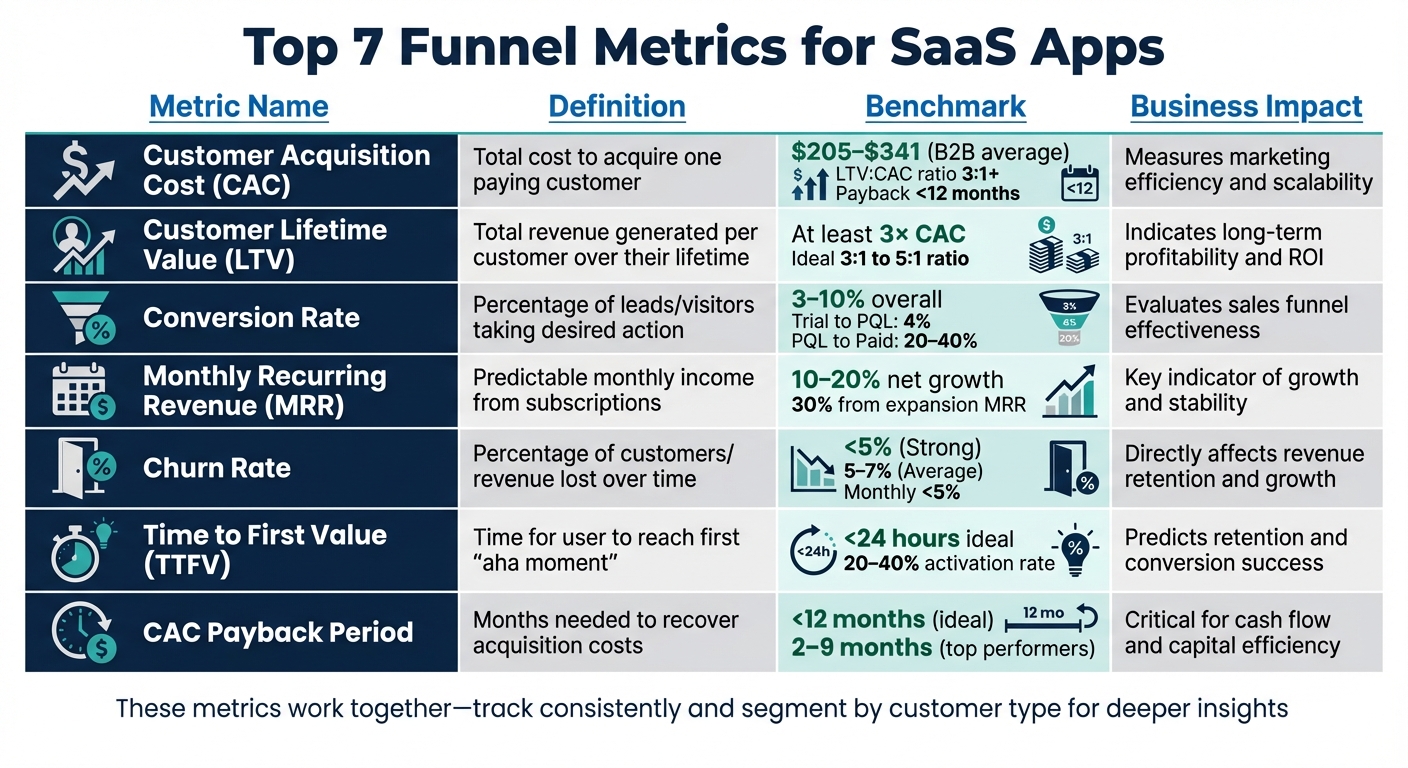
The table below provides a clear overview of key metrics, including their definitions, industry benchmarks, and how they influence business outcomes.
| Metric | Definition | Benchmark | Business Impact |
|---|---|---|---|
| Customer Acquisition Cost (CAC) | The total expense of acquiring a new customer [1]. | $205–$341 (B2B average) [1]. | Measures marketing efficiency and scalability [1]. |
| Customer Lifetime Value (LTV) | The total revenue a customer is expected to generate throughout their relationship with the business [1]. | At least 3× CAC [7]. | Highlights long-term profitability and return on investment [7]. |
| Conversion Rate | The percentage of leads or trial users who become paying customers [1]. | 3–10% (SaaS average) [1]. | Evaluates how well the sales funnel performs [1]. |
| Monthly Recurring Revenue (MRR) | Predictable revenue generated monthly from active subscriptions [5]. | ~21% Expansion MRR rate [1]. | Serves as a key indicator of business growth and stability [5]. |
| Churn Rate | The percentage of customers who cancel their subscriptions during a given period [1]. | <5% (Strong); 5–7% (Average) [1]. | Directly affects revenue retention and limits growth potential [15]. |
| Time to First Value (TTFV) | The time it takes for a user to experience their first significant benefit or "Aha" moment [1][38]. | 20–40% Activation Rate [4]. | Predicts retention rates and conversion success over time [3]. |
| CAC Payback Period | The number of months required to recover the cost of acquiring a customer [7]. | <18 months (Standard); <12 months (Ideal) [2]. | Essential for maintaining healthy cash flow and efficient capital use [15]. |
These metrics are deeply interconnected. For instance, a low CAC means little if churn rates are high, preventing customers from reaching break-even. Similarly, strong MRR growth can be misleading if it relies heavily on new customer acquisition without ensuring retention or upselling. These relationships underscore the importance of balancing acquisition, retention, and growth strategies to sustain SaaS success.
Conclusion
Funnel metrics are a cornerstone of sustainable SaaS growth. Without a clear understanding of how users move through your funnel, you could be pouring resources into strategies that don’t deliver. As Serena Miller from Outreach explains:
"Sales metrics are a useful way to quantify the complex buying process that's filled with human interactions, emotions, and decisions" [24].
Consider this: sales teams fall short of their conversion goals by over 37% due to inefficiencies at the top of the funnel [24]. That’s a huge, measurable gap - and one that highlights the critical importance of tracking the right data.
The secret lies in focusing on metrics that matter. Vanity stats like total website visits might look impressive, but they don’t tell you why 96% of visitors leave without making a purchase [39]. Nor do they show where users drop off during onboarding. Instead, prioritize data that directly impacts your bottom line, such as conversion rates at each stage, churn trends by cohort, and the balance between customer acquisition cost (CAC) and lifetime value (LTV). Companies that align sales and marketing teams around these shared metrics see 67% higher conversion rates and generate 208% more revenue from their marketing efforts [40]. That’s the power of a data-driven approach.
Cohort tracking is another game-changer. By segmenting users based on signup dates or acquisition channels, you can uncover which groups bring the highest lifetime value and which are most at risk of churning. This level of detail lets you act early - like reaching out to inactive users before they cancel. And considering that retaining a customer costs 6 to 7 times less than acquiring a new one [4], it’s a strategy worth prioritizing.
To make all this work, align your metrics with actionable strategies. Automating your tracking through dashboards or CRMs saves time and provides real-time insights, allowing you to focus on optimizing what truly matters. After all, you can’t improve what you don’t measure.
Start small by tracking a few core metrics, and let the data guide your next steps. Measurement isn’t just about numbers - it’s the foundation for smarter, growth-focused decisions.
FAQs
What are the best ways to lower Customer Acquisition Cost (CAC) for my SaaS app?
To bring down your Customer Acquisition Cost (CAC), start by keeping a close eye on key metrics such as cost per lead, conversion rates at every stage of your funnel, and spending across different channels. This will help you pinpoint areas where you're overspending or where your funnel isn't performing as well as it could. By shifting your budget toward channels that deliver better results and fine-tuning the ones that lag, you can cut down on waste and focus your efforts on what truly works.
Another way to lower CAC is to streamline your funnel for better efficiency. Make it easier for leads to convert by simplifying your signup process, sharpening your ad targeting, and offering a fast-track onboarding experience that delivers value quickly. You can also tap into referrals from happy customers - an affordable and effective way to bring in new users.
Lastly, keep evaluating and tweaking your CAC strategy. Use the standard formula (total sales and marketing spend ÷ number of new customers) to identify costly acquisition channels. Experiment with more budget-friendly approaches like content marketing or organic SEO to see what works best. Tools such as ClackyAI can also play a role by speeding up product development, helping you reach customers faster and start generating revenue sooner, which can reduce upfront costs significantly.
How can I reduce customer churn for my SaaS app?
Reducing churn hinges on delivering value swiftly and consistently. Start by crafting a personalized onboarding experience that enables new users to see meaningful results within just a few days. Tools like in-app guidance and contextual tips can keep users engaged by offering help exactly when they need it, lowering the chances of cancellations.
Leverage customer data - such as usage patterns and feature adoption - to pinpoint accounts that might be at risk. Proactively reaching out with a check-in email, a brief tutorial, or even a time-sensitive discount can rekindle interest and prevent users from leaving. Regularly gather feedback through in-app surveys or NPS polls, and show users their voices matter by incorporating their suggestions into product updates. Offering flexible pricing options, like monthly subscriptions or usage-based plans, can also accommodate users as their needs evolve.
By prioritizing quick onboarding, proactive communication, and adaptable pricing, you not only improve retention but also transform satisfied users into enthusiastic advocates for your product.
Why is Time to First Value (TTFV) important for retaining SaaS customers?
A shorter Time to First Value (TTFV) plays a crucial role in keeping customers on board by quickly highlighting the main benefits of your product. When users see value early on, they’re more likely to feel satisfied, remain engaged, and renew their subscription.
By cutting down TTFV, you’re not just boosting customer satisfaction - you’re also reducing churn. This creates a solid base for long-term growth and loyalty. For SaaS companies, focusing on TTFV is essential for building trust and ensuring customers stay committed.