


5 Real-Time Dashboard Use Cases for SaaS
Real-time dashboards give SaaS companies an edge by providing live, actionable data to make faster decisions. Unlike batch reports, which rely on outdated data, these dashboards update in seconds, helping teams monitor critical metrics like revenue, user behavior, system performance, customer health, and growth funnels. The result? Faster issue detection, better resource allocation, and improved decision-making.
Key Use Cases:
- Revenue Monitoring: Track MRR, ARR, churn, and CAC:LTV ratios to spot issues like broken payment flows immediately.
- User Behavior Tracking: Analyze DAU, MAU, and feature adoption to improve onboarding and reduce churn.
- System Performance Monitoring: Monitor latency, error rates, and server health to address problems before they impact users.
- Customer Retention: Use health scores and engagement data to identify at-risk customers and reduce churn.
- Growth Optimization: Quickly identify and fix conversion issues, like broken signup forms or underperforming campaigns.
Why It Matters:
- Immediate Insights: React to problems in seconds, not days.
- Improved Growth: Companies using real-time data grow 23% faster.
- Better Decisions: Align teams with a single source of truth.
Quick Tip: Combine real-time dashboards for live metrics with batch reports for long-term trends to get the best of both worlds.
AI Powered SaaS Metrics Dashboard
sbb-itb-c336128
1. Revenue and Subscription Monitoring
In the world of SaaS, keeping a close eye on revenue and subscription metrics is crucial, and real-time analytics has made this process faster and more effective. Revenue dashboards track essential metrics like MRR (Monthly Recurring Revenue), ARR (Annual Recurring Revenue), churn rates, ARPU (Average Revenue Per User), and LTV (Lifetime Value) - all of which provide a clear snapshot of business health.
The beauty of real-time monitoring lies in its immediacy. Instead of waiting until the end of the month to discover issues like a broken payment flow, you can identify and address them within minutes. Matt Smith, COO and Founder of Later, explains the impact:
"Thanks to Baremetrics, we're able to know what's going on with our revenue and customers, in real-time. Absolutely invaluable and miles ahead of doing it in spreadsheets or coding your own" [9].
Core Metrics to Watch
Key metrics to focus on include MRR, ARR, churn rates, ARPU, NRR (Net Revenue Retention), trial-to-paid conversion rates, and the critical CAC (Customer Acquisition Cost) to LTV ratio, which ensures sustainable growth [8][10].
Real-World Applications and Decisions
Take the example of SalesLoft, which introduced a real-time pricing dashboard in August 2025. By integrating their CRM, billing system, and product analytics, they achieved some impressive results: an 18% boost in ARPU, a 12% improvement in trial-to-paid conversion rates, and a 22% reduction in revenue leakage [5]. Their VP of Revenue Operations emphasized:
"Having real-time visibility into how our pricing performs across segments has fundamentally changed our ability to optimize revenue. We've moved from quarterly pricing reviews to a continuous optimization model" [5].
Real-time insights also enable better resource allocation. For example, if revenue trends take a dip, founders can quickly redirect development resources toward growth initiatives instead of waiting for quarterly reviews. This level of transparency not only aids internal decision-making but also strengthens investor confidence by providing immediate, accurate updates on company performance [4].
Tools and Integrations You’ll Need
For an effective revenue dashboard, integration is key. These dashboards pull data from billing platforms like Stripe, Recurly, Braintree, and Chargebee [4][9]. Pairing this with CRM systems such as Salesforce or HubSpot allows you to align revenue data with customer segments and sales pipelines [5][11]. Tools like Baremetrics, ChartMogul, and ProfitWell automate the tracking of SaaS metrics directly from payment gateways. Meanwhile, platforms like Qrvey and Explo provide embedded analytics with multi-tenant dashboard functionality [10][12].
To stay on top of changes, real-time alerts via tools like Slack ensure teams are notified immediately of key updates [9][11].
Why Real-Time Analytics Matter for SaaS Teams
Automated dashboards offer a single, reliable source of truth, fostering alignment across teams by providing shared visibility into live metrics [4]. Companies that actively monitor metrics like ARPU and the CAC:LTV ratio grow 23% faster than those that don’t [5].
Even small improvements can make a big difference. For instance, a 1% improvement in pricing optimization can lead to an 11–15% increase in profits [5]. Real-time dashboards enable you to fine-tune pricing by segmenting data - whether by country, plan level, or UTM tag - helping you identify which customer groups bring the most value [4]. With these insights in hand, the next step is to dive into tracking user behavior, which builds on this foundation of revenue monitoring.
2. User Behavior and Product Engagement Tracking
Once you've established your revenue metrics, the next step is to dive into how users interact with your product. Real-time dashboards can be a game-changer, offering a clear view of user patterns, helping to resolve issues quickly, and improving the overall experience to minimize churn.
Core Metrics Tracked
To measure engagement effectively, focus on metrics like Daily Active Users (DAU), Weekly Active Users (WAU), and Monthly Active Users (MAU). These numbers provide a snapshot of your growth trajectory. Another key metric is user stickiness, calculated as DAU/MAU, which shows how often users return. Beyond these, tracking feature adoption rates, session duration, time to activation (how quickly new users discover value), and retention curves offers deeper insights into how engagement evolves over time.
Primary Use Cases and Decisions Enabled
Real-time engagement data can transform how you approach onboarding. By identifying where users drop off during free trials, you can make targeted adjustments - like adding tooltips or personalized prompts - to guide them through the process. This data also shapes your product roadmap by revealing which features users find most valuable and which ones need refinement. Sudden drops in activity can signal potential churn, allowing you to act quickly with customer success interventions. A great example of this is the app Calm, which tripled its user retention in 2017 after adopting Amplitude's real-time analytics. This move played a role in Calm being named Apple’s App Store App of the Year [3].
Key Integrations and Tools Required
Building a robust engagement dashboard requires the right tools. Platforms like Userpilot, Mixpanel, or Amplitude are essential for product analytics. Pair these with CRM systems like Salesforce or HubSpot to connect user behavior data to customer profiles. Adding billing tools such as Stripe or Chargebee helps link engagement metrics directly to revenue. To stay on top of significant changes, set up alerts via Slack or email whenever engagement thresholds are met.
Real-Time Benefits for SaaS Teams
Real-time insights allow teams to see the immediate impact of product updates or feature launches. For instance, Life360 replaced its outdated analytics system - which had a 24-hour data delay - with Amplitude's real-time dashboards. This upgrade enabled the team to monitor user engagement and feature performance within minutes [3]. Quick access to this data helps teams identify and resolve issues like broken signup flows or malfunctioning features before they escalate. By providing a unified view of user activity, these insights complement system performance monitoring, ensuring both stability and a seamless user experience.
3. System Performance and Deployment Monitoring
Real-time dashboards provide instant access to critical data on server health, application performance, and deployment stability. This immediate visibility is essential for identifying and addressing issues before they impact users, a key goal when building a working system.
Core Metrics Tracked
Keeping an eye on key infrastructure metrics - like CPU usage, memory utilization, disk space, and network traffic - is crucial. On the application side, latency, error rates, and throughput are monitored to ensure smooth functionality and user satisfaction [14]. During deployments, sudden increases in latency or a spike in 404/500 errors can signal problems with new feature rollouts [1]. Monitoring database performance is equally important; tracking blocking queries, high CPU or disk usage, and unusual locks helps maintain system speed [2].
"Real-time dashboards pinpoint friction issues immediately. Spikes in latency? A surge in 404 errors? You'll see it before your customers do."
– Vaishnavi Shah, Technical Content Writer, ThoughtSpot [1]
Primary Use Cases and Decisions Enabled
Real-time dashboards empower engineers to link performance issues directly to specific deployment events, version updates, or infrastructure changes. SLO burn rate monitoring offers early warnings by measuring error budget consumption [15][6]. Overlaying CI/CD deployment data onto performance graphs makes it easier to spot regressions introduced by new releases [15][6]. Additionally, dashboards with integrated links allow on-call engineers to dive straight into filtered logs or traces, significantly cutting down Mean Time to Recovery (MTTR) [15].
Key Integrations and Tools Required
To collect and visualize data effectively, connect to host agents for CPU and memory metrics, cloud services for instance health, and APM tools for response times and error tracking [14]. Real-time streaming platforms like Redpanda (Kafka-compatible) and data processing tools like Tinybird or Propel can turn raw event streams into queryable APIs [7][6]. Visualization platforms such as Grafana, Datadog, or Prometheus make these metrics accessible and easy to interpret. For critical systems, data should refresh every 15 seconds with at least 24 hours of retention for troubleshooting, while business metrics can update every minute [14].
Real-Time Benefits for SaaS Teams
Speed is the game-changer here. NVMe-backed hardware for data streaming can deliver insights 5× to 10× faster than traditional observability tools [2]. This enables real-time monitoring of deployments, preventing issues from going unnoticed for hours. For small to medium-sized businesses, a 1-minute refresh rate strikes a good balance between timely updates and system efficiency [14]. Automated anomaly detection, which triggers alerts for error rate spikes - even if they last only 5 minutes - ensures problems are addressed before they escalate [15][16]. These monitoring practices integrate seamlessly into broader operational dashboards, keeping SaaS teams ahead of potential disruptions.
4. Customer Health and Retention Tracking
Real-time dashboards give SaaS teams the tools they need to spot at-risk customers before they churn. By keeping a close eye on key metrics like health scores, churn rates, DAU/MAU ratios, and feature usage, teams can move from playing defense to playing offense - jumping in as soon as engagement dips or when key customer contacts leave [17]. This shift to proactive tracking sets the stage for well-timed interventions.
Core Metrics Tracked
To keep tabs on customer health, SaaS teams monitor several key metrics:
- Customer Churn Rate: The percentage of customers who cancel their subscriptions.
- Revenue Churn: The revenue lost due to cancellations or plan downgrades.
- Net Promoter Score (NPS): A measure of customer satisfaction and loyalty.
- User Stickiness: The ratio of Daily Active Users (DAU) to Monthly Active Users (MAU), showing how often users return.
- Feature Engagement: Tracks how effectively users are leveraging core features.
- Expansion Revenue: Revenue growth from upselling or upgrading existing customers.
Another critical metric is trial-to-paid conversion rates. A well-structured trial process can convert 25–50% of users into paying customers [10]. Together, these metrics equip teams to act quickly and reduce customer churn.
Primary Use Cases and Decisions Enabled
Real-time tracking makes automated health scoring possible, which can trigger specific playbooks or outreach campaigns whenever a score dips [17]. Companies that focus on these metrics report impressive results: 83.6% anticipate revenue growth, and 88% believe proactive tracking significantly reduces customer losses [17].
"The faster you can spot negative trends or issues in your business, the less long-term damage it'll cause you."
– Dominique Jackson, Former Content Marketer, Baremetrics [4]
Key Integrations and Tools Required
Tracking customer health effectively depends on pulling data from multiple sources into a unified view:
- Billing Platforms: Tools like Stripe, Chargebee, and Recurly provide data on monthly recurring revenue (MRR) and churn.
- CRM Systems: Platforms such as Salesforce and HubSpot capture customer lifecycle events.
- Support Tools: Zendesk and Intercom offer insights into ticket volumes and customer sentiment.
- Product Analytics: Solutions like Amplitude and Mixpanel track feature usage and session durations.
- Specialized Dashboard Tools: Platforms like Baremetrics, ChartMogul, Tinybird, and Hex deliver both ready-to-use and customizable dashboards [18].
Companies that integrate data from these sources into their analytics see a threefold increase in returns on their analytics investments [5].
Real-Time Benefits for SaaS Teams
In 2025, JobNimbus, a CRM and project management platform, tackled its churn problem by implementing real-time, personalized dashboards using Qrvey's analytics. This upgrade allowed customers to monitor their own performance within the platform, boosting enterprise user adoption by 70% and significantly lowering churn rates [12]. Real-time alerts now notify customer success managers the moment critical metrics - like login frequency or feature engagement - take a hit, enabling quick action to maintain customer satisfaction [1]. By segmenting data based on plan type, region, or industry, teams can pinpoint high-churn groups and design targeted strategies to win them back.
5. Growth and Conversion Funnel Optimization
Real-time dashboards give SaaS teams the ability to identify conversion issues as they happen and make adjustments quickly. Instead of waiting days for batch reports to uncover problems - like a broken signup form or a failing ad campaign - teams can detect and resolve these issues within minutes, saving both time and budget [1]. This shift from periodic reviews to continuous optimization changes how marketing and product teams operate, turning real-time insights into actionable strategies that boost revenue and engagement.
Core Metrics Tracked
Growth-focused dashboards keep a close eye on key metrics such as trial-to-paid conversion rates (which often range from 25–50% depending on the industry [10]), Customer Acquisition Cost (CAC) by channel, Product-Qualified Leads (PQLs) identified through specific usage patterns [20], and time-to-activation for new users [13]. They also monitor conversion rates by pricing tier, feature adoption trends, and upsell-driven expansion revenue [5]. Companies that consistently track these metrics report 23% faster growth compared to those that don’t [5].
Primary Use Cases and Decisions Enabled
Marketing teams rely on live data to adjust budgets during campaigns, reallocating funds from underperforming channels to those delivering better results before the budget is exhausted [1]. Product teams use real-time feedback from A/B tests to make decisions in hours rather than weeks, cutting decision-making time by up to seven days compared to traditional platforms [19]. Automated alerts flag sudden drops in conversion rates, prompting immediate investigations into potential causes like broken forms, server issues, or pricing concerns [5][11].
Key Integrations and Tools Required
To provide a full picture of conversion performance, effective dashboards pull data from CRM, billing systems, and product analytics tools [5][13]. For instance, Klipfolio's marketing team uses a real-time "Spend/Trial" ratio to ensure their AdWords campaigns stay within a $10 per trial target [22]. Companies that integrate multiple data sources into their analytics see up to three times the return on their analytics investments [5]. Some teams even display these metrics on office monitors to encourage accountability and foster a data-driven mindset [21][22].
Real-Time Benefits for SaaS Teams
The benefits of real-time dashboards are hard to overstate. By eliminating the delays of batch processing, teams can catch critical issues - like a broken signup form - before they result in significant revenue loss [1][3]. Rapid testing and iteration on pricing, messaging, and onboarding flows help address friction points before they lead to churn [13]. These real-time capabilities not only improve growth metrics but also amplify the broader operational benefits discussed earlier, delivering measurable impact across the SaaS business.
Batch Reporting vs Real-Time Dashboards
Batch Reporting vs Real-Time Dashboards Comparison for SaaS
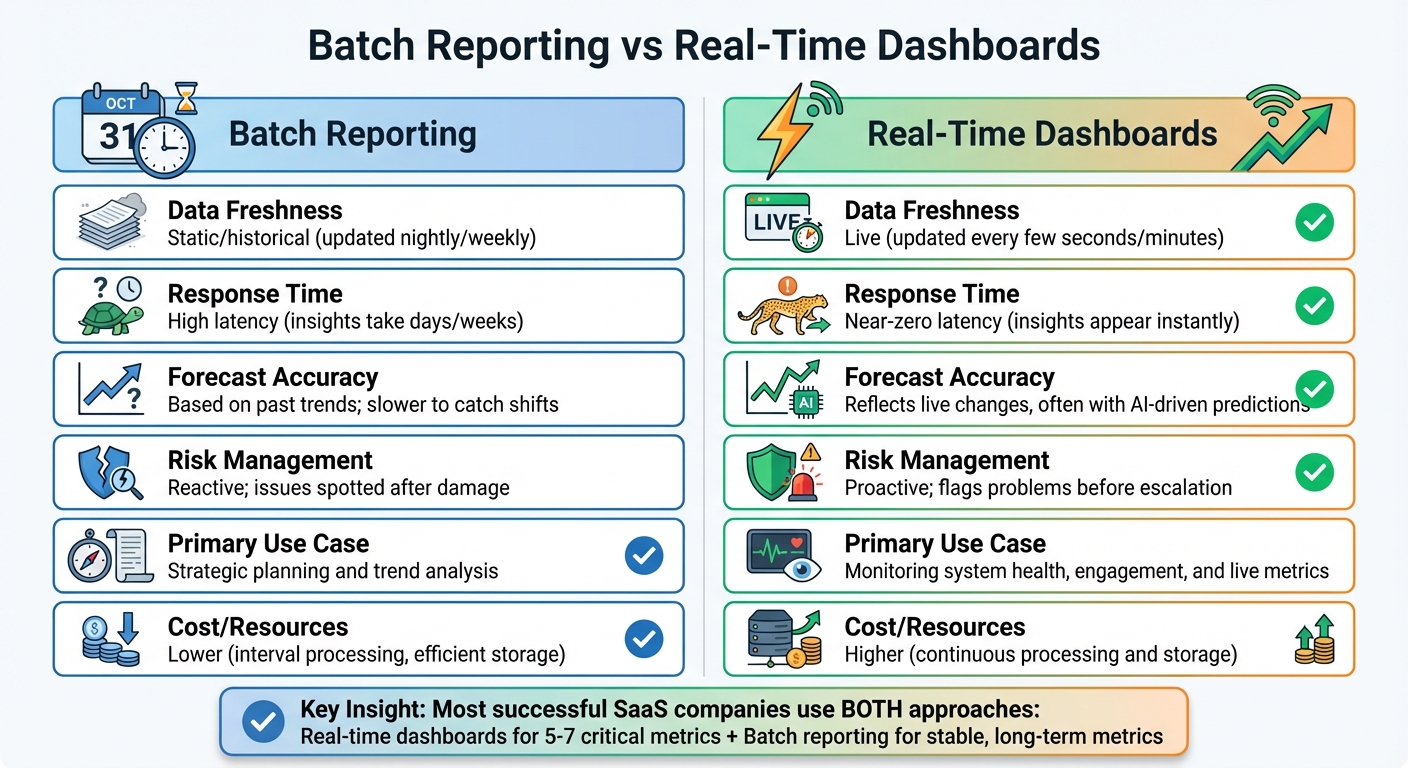
Choosing between batch reporting and real-time dashboards comes down to your goals. Batch reporting works best for analyzing long-term trends and supporting strategic decisions, like quarterly or yearly reviews that rely on months or years of historical data. On the other hand, real-time dashboards are ideal for quick, tactical decisions - whether it's identifying a broken signup form or reallocating ad spend during a live campaign. Each method serves a distinct purpose, providing value in different operational contexts.
The key trade-off here is latency versus cost. Real-time systems offer near-instant updates, with data appearing on dashboards within seconds of user activity. However, this speed comes at a price, requiring significant investment in constant data processing and storage. Batch reporting, on the other hand, updates less frequently - nightly or weekly - making it more cost-efficient when immediate updates aren't critical.
Take the example of Baremetrics during February–March 2020. By leveraging real-time data, the team quickly identified a slowdown in Monthly Recurring Revenue (MRR). Instead of waiting for a monthly report, they acted immediately, implementing new growth strategies like focusing on upsells and testing a new product line. These timely adjustments helped them regain positive growth momentum.
| Feature | Batch Reporting | Real-Time Dashboards |
|---|---|---|
| Data Freshness | Static/historical (updated nightly/weekly) | Live (updated every few seconds/minutes) |
| Response Time | High latency (insights take days/weeks) | Near-zero latency (insights appear instantly) |
| Forecast Accuracy | Based on past trends; slower to catch shifts | Reflects live changes, often with AI-driven predictions |
| Risk Management | Reactive; issues spotted after damage | Proactive; flags problems before escalation |
| Primary Use Case | Strategic planning and trend analysis | Monitoring system health, engagement, and live metrics |
| Cost/Resources | Lower (interval processing, efficient storage) | Higher (continuous processing and storage) |
Most successful SaaS companies combine both approaches. Real-time dashboards are best for tracking 5–7 critical metrics that demand immediate attention, like system errors, user activity spikes, or ad spend. Meanwhile, batch reporting is better suited for stable, long-term metrics like Annual Recurring Revenue (ARR) that don’t require constant monitoring. Together, these tools provide a comprehensive view, balancing strategic insights with tactical responsiveness in SaaS analytics.
Conclusion
Real-time dashboards can shift SaaS operations from constantly reacting to problems to taking proactive steps. Companies that monitor live data often grow up to 23% faster than those relying solely on periodic reports [5]. Catching revenue leaks, system issues, or dips in conversions as they occur - rather than discovering them days or weeks later - means quicker decisions and better overall results.
These dashboards also provide a single source of truth, bringing Sales, Marketing, Finance, and Engineering teams together around the same real-time metrics. This shared transparency reduces the confusion caused by conflicting reports and ensures everyone is working with accurate, up-to-date data. Teams using integrated real-time dashboards have reported smoother collaboration across departments and more confident decision-making.
Beyond fostering growth, this approach improves efficiency across the board. And the good news? Building and managing these systems no longer requires a large engineering team. Platforms like ClackyAI make it easier by automating data integration and dashboard setup. With features like AI-powered diagnostics, real-time collaboration, and advanced analytics, teams can quickly create functional monitoring systems and refine them based on real-world needs. The actionable insights discussed earlier are now more accessible than ever, turning data into practical tools for success.
FAQs
How can real-time dashboards help SaaS companies make better decisions?
Real-time dashboards give SaaS companies a clear window into essential metrics like revenue, user activity, churn rates, and system performance - all in the moment. With live updates and critical alerts, these dashboards make it easier for teams to spot trends, tackle operational challenges, and react to customer behavior as it unfolds.
This level of instant insight helps leaders make quicker, data-backed decisions, adapt to shifting market conditions, and keep operations running smoothly. From boosting user engagement to enhancing system reliability, real-time dashboards have become must-have tools for staying agile in the fast-paced SaaS world.
What are the most important metrics to monitor on a SaaS real-time dashboard?
A SaaS real-time dashboard should highlight key performance metrics that drive meaningful decisions. These metrics include:
- Monthly/Annual Recurring Revenue (MRR/ARR): Gives a clear picture of revenue trends over time.
- Average Revenue Per User (ARPU): Helps gauge the value each customer brings to the business.
- Customer Acquisition Cost (CAC) and its ratio to Customer Lifetime Value (CLTV): Measures the efficiency and profitability of acquiring new customers.
- Churn Rate and Net Revenue Retention: Tracks how well the business retains customers and generates growth from existing ones.
Additional metrics like MRR growth rate, pricing plan distribution, and tier conversion rates can also provide deeper insights. Keeping tabs on these numbers enables SaaS businesses to make informed choices, fine-tune strategies, and enhance the overall user experience.
How can SaaS businesses use real-time data to reduce customer churn?
Real-time data gives SaaS teams a clear, immediate view of how customers interact with their product. This makes spotting early signs of disengagement much easier. By monitoring things like usage trends, feature adoption, and support interactions on live dashboards, businesses can calculate account health scores and identify users who might be at risk of leaving.
Armed with this information, companies can take action right away. They might send personalized in-app messages, provide focused onboarding assistance, or even open support tickets proactively if they notice a drop in usage or underutilized features. Real-time dashboards also empower product teams to quickly test and roll out updates aimed at boosting retention. Instead of reacting to churn after it happens, this strategy shifts the focus to keeping customers engaged, which helps stabilize recurring revenue.