







Retention Metrics: How to Measure Success
Retention is the key driver of sustainable growth. Without it, acquiring new users becomes a costly, short-term fix. Here’s what you need to know:
- Retention vs. Churn: Retention tracks who stays, churn tracks who leaves. Together, they reveal product health.
- Key Metrics: Focus on Customer Retention Rate (CRR), Net Revenue Retention (NRR), and Customer Lifetime Value (CLV). These metrics measure loyalty, revenue trends, and long-term profitability.
- Examples: Calm improved retention 3x by emphasizing daily reminders. Rappi boosted retention 2.5x with their "Prime" trial.
- Formulas:
- CRR = [(Ending Customers - New Customers) / Starting Customers] × 100
- NRR = [(Starting MRR + Expansion - Contraction - Churn) / Starting MRR] × 100
- CLV = ARPU / Customer Churn Rate
- Why It Matters: Retaining customers is 5-9x cheaper than acquiring new ones. A 5% retention increase can boost profits by 25-95%.
- Benchmarks: SaaS companies should aim for retention rates above 90% and NRR over 120%.
Retention metrics are essential to understand user behavior, improve loyalty, and drive long-term business success. Focus on early user actions, cohort analysis, and revenue trends to refine your strategies.
Two Methods to Run Retention Analysis | SaaS Metrics School | The SaaS CFO | Free Retention Template
Core Retention Metrics and Formulas
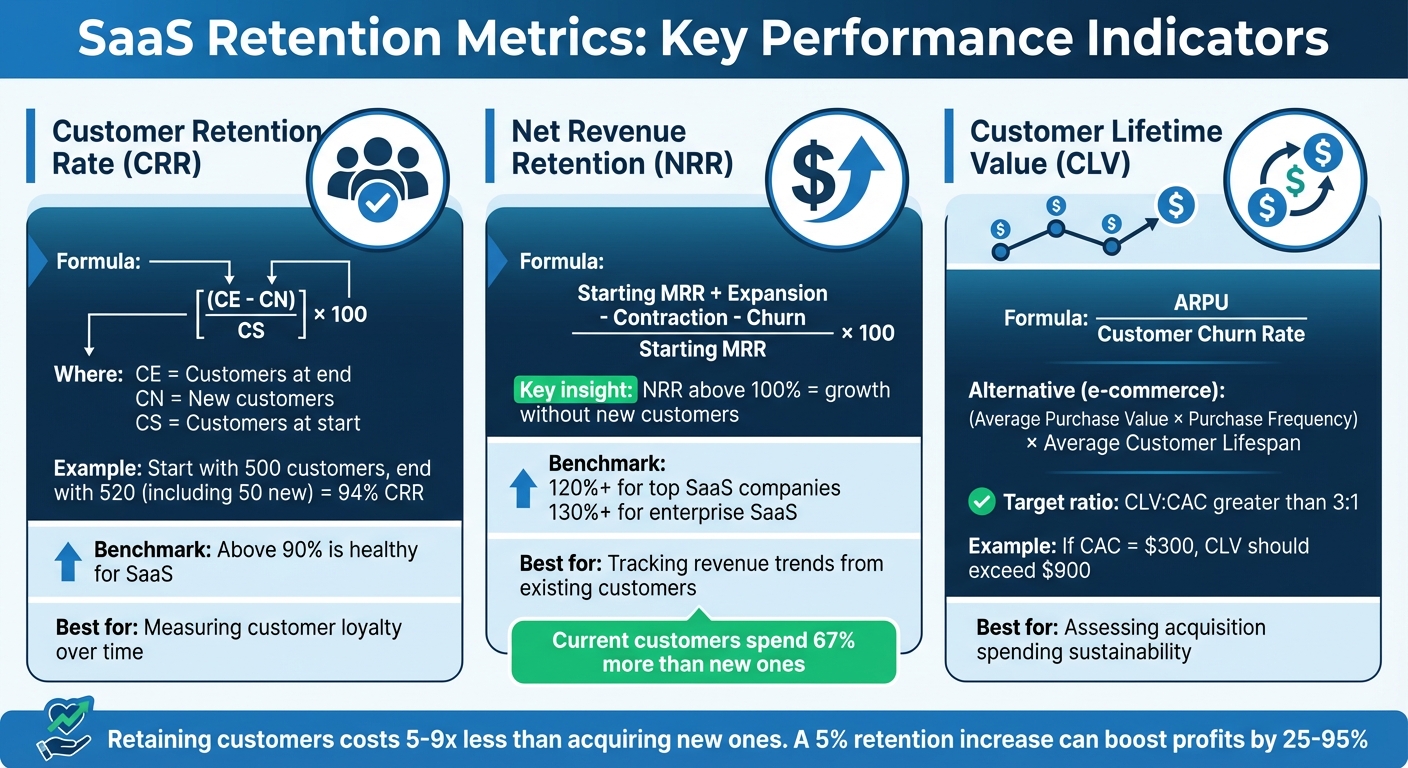
Core Retention Metrics Comparison: CRR, NRR, and CLV Formulas and Benchmarks
Retention and churn rates are critical indicators of your business's overall health. Let's break down the key metrics that help measure and improve customer loyalty and revenue growth.
Customer Retention Rate (CRR)
Customer Retention Rate (CRR) shows the percentage of customers you retain over a specific time frame, excluding any new customers acquired during that period. Here's the formula:
CRR = [(CE - CN) / CS] × 100
- CE: Customers at the end of the period
- CN: New customers acquired
- CS: Customers at the start of the period
For example, if you start January with 500 customers and end with 520, including 50 new ones, the CRR would be: [(520 - 50) / 500] × 100 = 94%. In SaaS, a retention rate above 90% is considered healthy [11][12].
Industry benchmarks vary widely. For instance, manufacturing typically sees 17% retention after the first month, while education lags behind at 10%. The average across industries is about 14% for month-one retention [9].
Tracking meaningful engagement is key. Instead of counting simple logins, focus on a "critical event" that signals actual use of your product. For Spotify, this could mean playing a song rather than just opening the app [9][16]. This ensures your metrics reflect genuine customer activity.
Net Revenue Retention (NRR)
While CRR focuses on customer count, Net Revenue Retention (NRR) highlights revenue trends among your existing clients. It accounts for expansions (upgrades), contractions (downgrades), and churn (cancellations). Here's the formula:
NRR = (Starting MRR + Expansion - Contraction - Churn) / Starting MRR × 100
NRR is especially valuable because it reveals whether your existing customers are spending more over time. An NRR above 100% indicates growth without needing new customers - this is often referred to as "negative churn" [11]. For SaaS businesses catering to enterprises, an NRR of 130% or more is a strong target [14].
Why does NRR matter more for revenue-focused businesses? Because it prioritizes customers by their financial contribution. For example, losing multiple small accounts might not seem alarming until you realize a single high-value client has left [7][13].
"Current customers spend an average of 67% more than new ones." - Paddle [14]
To get the full picture, track Monthly Recurring Revenue (MRR) retention alongside user retention. This ensures you're not masking declining profitability with rising user numbers [15].
Customer Lifetime Value (CLV)
Customer Lifetime Value (CLV) estimates the total revenue a customer will bring in during their relationship with your business. It's a critical metric for evaluating the success of your retention strategies. For SaaS companies, the formula is:
CLV = ARPU / Customer Churn Rate
- ARPU: Average Revenue Per User
For e-commerce or transactional models, use:
CLV = (Average Purchase Value × Purchase Frequency) × Average Customer Lifespan [13][14].
CLV provides a long-term view of your business's financial stability [7]. When paired with Customer Acquisition Cost (CAC), it helps determine profitability. A strong CLV:CAC ratio is greater than 3:1. For example, if acquiring a customer costs $300, their lifetime value should exceed $900 to ensure sustainability [14].
Retaining customers is far more cost-effective than acquiring new ones. Studies show it costs five to nine times less to keep an existing customer, and the likelihood of selling to them is over 60%, compared to just 5-20% for new prospects [10][13][14]. A good example is SafetyCulture's AI Document Converter, which led to an 18% increase in 30-day retention by helping users create courses faster [9].
| Metric | Formula | Best Use Case |
|---|---|---|
| Customer Retention Rate (CRR) | [(CE - CN) / CS] × 100 | Measuring customer loyalty over time |
| Net Revenue Retention (NRR) | (Starting MRR + Expansion - Contraction - Churn) / Starting MRR × 100 | Tracking revenue trends from existing customers |
| Customer Lifetime Value (CLV) | ARPU / Customer Churn Rate | Assessing acquisition spending sustainability |
Additional Retention Metrics
Beyond the primary indicators, there are several additional metrics that can provide a deeper understanding of why customers stay or leave. These metrics complement core measures by uncovering behavioral trends that might otherwise go unnoticed.
Cohort Retention Rate
Cohort Retention Rate tracks the percentage of users within a specific group (or cohort) who remain active over a set period. To calculate it, divide the number of active users during a given timeframe by the total number of users in the original cohort [19].
Cohorts can be categorized in various ways:
- Acquisition cohorts: Group users by when they signed up (e.g., January vs. February).
- Behavioral cohorts: Cluster users based on specific actions, such as completing onboarding or using a key feature.
- Predictive cohorts: Leverage machine learning to identify users likely to churn or upgrade [18][19].
This analysis can reveal trends that overall metrics might obscure. For example, while overall retention may seem steady, newer cohorts could show increased churn. Businesses that regularly analyze cohorts are 30% more likely to spot these patterns early, and top SaaS companies often achieve net revenue retention exceeding 120% within a year [17].
"Cohort-based forecasting models typically reduce forecast error by 30-40% compared to traditional methods." - Tomasz Tunguz, Partner, Redpoint Ventures [17]
For deeper insights, consider using inverted cohorts - comparing users who adopted a feature against those who didn’t [18].
Next, let’s look at how the Repeat Purchase Rate sheds light on customer loyalty.
Repeat Purchase Rate
Repeat Purchase Rate (RPR) measures the percentage of customers who make more than one purchase within a defined period. Calculate it by dividing the number of repeat customers by the total number of unique customers, then multiplying by 100 [20][23].
Repeat customers are often more profitable. Studies show that increasing customer retention by just 5% can boost profits by 25% to 95% [21][22]. In e-commerce, a small group - just 8% of customers - contributes about 41% of revenue [23]. A typical baseline for RPR is 20–30%, while rates above 50% indicate strong customer loyalty [20][21].
It’s essential to align this metric with your product’s lifecycle. Encouraging first-time buyers to make a second purchase is critical. Strategies like targeted discounts, loyalty programs, or win-back email campaigns can help convert one-time buyers into repeat customers [20][23].
Churn Rate
While retention and repeat purchase rates focus on customer loyalty, churn rate measures the opposite: customer loss. It calculates the percentage of customers who leave during a given period [2][6].
Churn can be broken down into:
- Logo churn: Counts the number of accounts lost, treating all customers equally.
- Revenue churn: Reflects the financial impact of lost customers, which is especially important when losing a high-revenue client can outweigh gains from smaller accounts [24].
Churn rates vary widely depending on the industry and business model. For example:
- Enterprise B2B SaaS typically sees annual churn rates between 5% and 10%.
- SMB-focused SaaS can experience churn as high as 30–50% [24].
- On average, B2B companies report churn around 5%, compared to 7% for B2C businesses [5].
"A single churn number without context and segmentation is nearly useless. It might satisfy board reporting requirements, but it won't drive improvement." - Rework [24]
To make churn data actionable, segment it by reason. This helps identify whether the issue lies in product shortcomings or customer support [24]. Additionally, tracking the "save rate" - the percentage of at-risk customers retained after intervention - can provide valuable insights. Research suggests that 60–70% of churn is preventable, while the remaining 30–40% stems from factors beyond your control [24].
sbb-itb-c336128
Tools for Measuring Retention
Once you've defined your key retention metrics, choosing the right tool becomes crucial for gaining insights that drive action. Analytics platforms can help uncover why users stick around - or why they leave.
Popular Retention Analytics Platforms
To monitor retention trends effectively, here are some platforms that stand out:
Amplitude focuses on identifying behaviors that lead to long-term retention. Its Compass tool pinpoints those critical "a-ha" moments - early actions that often predict whether users will remain engaged. With its Personas feature, Amplitude groups users into categories like power, core, and passive based on their engagement levels [25][27].
"Amplitude has helped us understand our users, and that's helped form a lot of our product decisions around how to increase retention."
– Trenton Huey, Head of Analytics, Life360 [27]
Mixpanel provides highly customizable retention reports and unique tracking options. Its Streak mode measures recurring user actions, such as daily logins, while Frequency reports dive into how often users engage within specific time frames [26]. This flexibility allows teams to differentiate between product stickiness and revenue cycles [28].
Google Analytics is another option for tracking general retention trends. While it’s often used in combination with more specialized tools, it can provide a solid starting point.
When selecting a platform, consider how your product's usage patterns align with the retention metric you’re tracking. For example, daily retention might fit apps that rely on habitual use (like social games), while weekly or monthly metrics could better suit services like food delivery or e-commerce [25][27]. Early user behavior is especially critical - studies show that over 80% of mobile app users drop off within the first three days [27].
Using ClackyAI for Retention Tracking
For teams integrating AI into product development, ClackyAI offers a unique approach to retention tracking while speeding up development cycles. This tool allows teams to iterate on products up to 10 times faster, making it easier to reduce churn by responding quickly to user feedback [29][31]. Considering that retaining a customer is far less expensive than acquiring a new one - by a margin of 5 to 25 times - this speed can make a big difference [30].
ClackyAI’s Full Codebase Awareness feature uses AI-driven diagnostics to monitor projects, helping developers address technical issues before they lead to user frustration and churn [29][31]. Additionally, its Task Time Machine tracks code changes in real-time, showing how updates impact product stability [29][31].
The platform simplifies adding retention-boosting features like authentication systems, payment processing, and community tools, without requiring complex setups [29]. It also supports collaboration by managing multiple AI agents simultaneously [29][31]. Research shows that 87% of small businesses see a positive return on investment within three months of adopting integrated retention tools [30].
ClackyAI offers flexible pricing, from a free Hobby plan to fully customizable Enterprise solutions, making it accessible to teams of all sizes.
Setting Benchmarks and Tracking Progress
Industry-Specific Benchmarks
Once you've nailed down the core retention metrics, the next step is setting benchmarks and tracking progress. This process helps pinpoint whether your challenges stem from internal product issues or broader market trends. Retention rates can vary widely based on industry, business model, and customer type.
Take SaaS companies, for instance. The size of your revenue plays a big role. If you're an early-stage business making between $0 and $1M in annual recurring revenue (ARR), a retention rate of 55% is typical. But as your ARR grows to $15-$30M, retention should climb to 76% or more [32]. The best SaaS companies push even further, achieving retention rates of 85-87%. However, only 11-19% of companies hit this mark. Those that do tend to grow 1.5x to 3x faster than their competitors [32].
Another key factor is Average Revenue Per Account (ARPA), which strongly influences churn. Products priced under $10 often see churn rates of 6-7% per month, while those priced over $500 drop to just 1-2% [32]. For example, a $5/month app will naturally experience more turnover than a $500/month enterprise tool, even if the product quality is the same.
Looking across industries, the average Month 1 retention rate is 14%, which dips to 12% by Month 2 and 11% by Month 3 [9]. These numbers vary depending on how frequently users need the product. Manufacturing and transportation tools, which address daily challenges, lead with a 17% Month 1 retention rate, while education platforms lag behind at 10% [9].
| Industry | Month 1 Retention | Month 2 Retention | Month 3 Retention |
|---|---|---|---|
| All Industries (Average) | 14% | 12% | 11% |
| Manufacturing | 17% | 15% | 14% |
| Transportation & Logistics | 16% | 13% | 12% |
| Hospitality | 16% | 13% | 12% |
| Financial Services | 15% | 12% | 11% |
| Information Technology | 15% | 12% | 11% |
| Healthcare | 14% | 12% | 11% |
| Retail | 12% | 9.5% | 8.5% |
| Education | 10% | 7.7% | 6.6% |
To make these benchmarks actionable, break them down by acquisition channel, pricing tier, and customer segment [32]. For example, a 70% retention rate might be excellent for small businesses but a red flag for enterprise clients. This segmentation helps you identify underperforming areas and focus your efforts where they're needed most.
Tracking Trends Over Time
Once benchmarks are in place, tracking changes over time is essential. This helps you spot patterns that single data points might miss. For example, a 5% monthly churn rate may not seem alarming, but over a year, it compounds to a 46% customer loss [32]. By analyzing retention over 6 to 12 months, you can account for seasonal trends and distinguish between short-term hiccups and long-term issues [7][32].
Cohort analysis is a powerful way to see if your strategies are working. By grouping customers based on their signup month, you can compare retention rates across different periods. Say your Month 3 retention for January signups was 15%, but March signups hit 20%. That improvement suggests your recent onboarding tweaks are paying off. Companies using this approach are 30% more likely to catch problems early, before they impact revenue [17].
Pay attention to early indicators of success. Actions users take in their first week often predict whether they'll stick around for months. For instance, Paired discovered that users struggled to find content during onboarding. By simplifying the process and highlighting popular conversation starters, they boosted engagement by 40% and reduced trial cancellations significantly [9].
Retention curves also tell a story. If your retention drops sharply from 50% on Day 1 to 15% by Day 30 but then levels off, you've identified your core user base. On the other hand, a curve that keeps declining suggests you're losing users continuously, indicating deeper issues. Whether the problem lies in onboarding or long-term engagement, analyzing these trends helps target the right areas for improvement [16].
Finally, track retention alongside revenue metrics for a full picture. Net Revenue Retention (NRR) can exceed 100% if expansion revenue from existing customers outweighs losses from churn. In contrast, customer retention (logo retention) maxes out at 100% [32]. Top-performing SaaS companies often maintain NRR above 120% [17]. Comparing NRR and logo retention can reveal whether you're losing many small customers or a few high-value ones - insights that inform very different strategies.
Conclusion
Retention is the backbone of sustainable growth. Without it, all the money spent on acquiring new users can quickly go to waste [8][1]. As Amplitude succinctly states:
"If you care about growth, then you should care about user retention" [8].
Measuring retention accurately turns vague strategies into actionable insights.
Tracking retention effectively is key [3]. This guide has broken down essential metrics like Customer Retention Rate (CRR) and Net Revenue Retention (NRR), giving you the tools to build a growth-focused strategy. It’s all about those critical first 24 to 48 hours - making an early impact on the retention curve can significantly shape long-term success [3].
To maximize retention, pick a method that matches how users interact with your product. For apps with daily usage, "Return On" tracking works best, while for others, "Return On or After" models are more fitting [3]. Pinpoint a key user action that reflects value and focus on tracking behavioral data instead of relying solely on surveys [4]. These targeted efforts lay the groundwork for sustained growth.
The strategies outlined here - from cohort analysis to Net Engagement Scores - offer a roadmap to success. Top-performing SaaS companies hit NRR above 120% by treating retention as a continuous process, not a one-time effort [17]. By applying these methods and constantly refining your approach, you can improve retention rates significantly. After all, the difference between a 70% retention rate and 85% can mean the leap from steady progress to exponential growth.
FAQs
What are the best ways to improve customer retention for my business?
Improving customer retention begins with truly understanding your users' behavior and responding to their needs in a way that resonates. Pinpoint the critical points in the customer journey where drop-offs are most common, and take steps to make those experiences better. Prioritize personalization, meaningful interactions, and well-designed loyalty programs to encourage repeat business.
Keep a close eye on key metrics like retention rate and customer lifetime value to measure your progress and uncover areas that need attention. Leverage data insights to fine-tune your product and marketing strategies, ensuring they reflect what your customers care about most. By consistently testing and adjusting your approach based on these insights, you can build stronger customer relationships and drive long-term success.
How can I use cohort analysis to track and improve retention?
To make the most of cohort analysis for retention tracking, start by organizing users into cohorts - groups that share common traits, like their signup date or specific actions they’ve taken. This approach helps you spot trends, such as when users tend to disengage or periods when activity spikes.
Visual tools like charts can make these patterns easier to understand. For instance, you might identify key drop-off points or times of peak engagement, giving you the chance to address challenges early. Pair these insights with behavioral data, like how often users interact with your product, to pinpoint what drives engagement or signals potential churn.
By regularly reviewing and comparing cohorts, you can track how product changes or marketing efforts affect retention. This ensures your decisions are backed by data, helping you address problems and support long-term growth.
Why is Net Revenue Retention (NRR) important for driving business growth?
Net Revenue Retention (NRR) is a crucial metric that shows how effectively your business retains and grows revenue from its existing customer base. It reflects the interplay of customer retention, churn, and expansion, offering a clear picture of your company’s ability to maintain and increase revenue over time.
Focusing on NRR helps businesses uncover ways to boost customer loyalty, encourage upsells, and minimize churn. A high NRR indicates strong customer relationships and consistent revenue growth - both of which are essential for sustainable scaling.