


Case Study: Scaling A SaaS App Without Downtime
Scaling a SaaS app without downtime is challenging but possible with the right strategies. Companies like Notion, Slack, and Knock have faced issues like database bottlenecks, high CPU usage, and storage limits. Their solutions included horizontal sharding, logical replication, and optimized deployment methods. For instance, Notion expanded its Postgres fleet, reducing CPU usage from over 90% to 20%. Knock upgraded its database version without downtime using replication techniques. Key takeaways include:
- Identify bottlenecks early: Use monitoring tools to track CPU, IOPS, and query performance.
- Test extensively: Conduct load tests and simulations to prepare for high traffic.
- Gradual migrations: Use step-by-step approaches like "dark reads" and reverse replication to ensure data consistency.
- Optimize databases: Implement sharding, index tuning, and replication to improve performance.
Scaling to 920M Users: MySQL to TiDB Migration | Zero Downtime Case Study | Mydbops Webinar
Original Architecture and Performance Problems
Before rolling out their scaling strategies, companies had to tackle some serious architectural and performance challenges.
Initial Architecture Overview
Early system designs often became bottlenecks as user traffic surged. Take DigitalOcean, for example: they operated a Rails monolith called "Cloud" alongside Perl services ("Scheduler" and "DOBE"), all of which communicated through a single MySQL database. This database also doubled as a message queue. By 2016, this setup had grown to over 15,000 direct database connections [6].
Slack initially built its infrastructure on a LAMP stack, with MySQL in an active-active configuration using asynchronous replication. They sharded data by workspace, meaning all data for a single team lived on one database shard. While this worked for smaller teams, it became a problem when large enterprise customers joined. Individual shards would hit hardware limits, leaving other shards underutilized [7]. Slack’s system was handling a staggering 2.3 million queries per second - 2 million reads and 300,000 writes [7].
Notion started with a single Postgres monolith hosted on Amazon RDS. As they scaled, they ran into CPU and IOPS issues, with shards hitting 90% CPU utilization during peak traffic and maxing out their disk bandwidth [3]. Worse, the Postgres VACUUM process, which prevents transaction ID wraparound, began stalling. This posed a major risk of a complete write outage [9].
Performance Bottlenecks and Failure Points
For DigitalOcean, the biggest issue was using MySQL as a message broker. Their primary polling query ballooned to over 150 lines and spanned 18 table joins. Sunny Beatteay, a software engineer at DigitalOcean, explained:
"The technical decisions you make early on tend to catch up with you later. ... Let me tell you about the time we had 15,000 direct connections to our database" [6].
This design led to table locks, query backlogs, and outages.
Slack faced a different challenge with its workspace-based sharding model. Arka Ganguli and the infrastructure team noted:
"What if a single team and all of their Slack data doesn't fit our largest shard? ... We were regularly hitting the limits of what that single host could sustain" [7].
When large enterprise customers joined, their data couldn’t be spread across multiple machines, causing individual shards to exceed their capacity.
For Notion, the crisis came when Garrett Fidalgo, Infrastructure Technical Lead, observed:
"Realizing that TXID wraparound would pose an existential threat to the product, our infrastructure team doubled down and got to work" [9].
The VACUUM process couldn’t keep up with the data volume, making even simple catalog migrations unsafe. Meanwhile, CPU spikes during peak hours were a constant headache for on-call engineers.
Checkly encountered a more subtle issue. Tim Nolet, Chief Evangelist, discovered that a key dashboard query’s response time had spiked from 100ms to 1 second. This single query consumed 32.4% of the database’s total execution time. The root cause? A missing composite index on (checkId, startedAt DESC), which forced Postgres to perform a "top-N heapsort" instead of an efficient index scan [10].
| Company | Architecture Type | Primary Bottleneck | Impact |
|---|---|---|---|
| DigitalOcean | Rails + Perl with MySQL message queue | 15,000+ connections; 150-line polling query | Table locks, query backlogs, outages |
| Slack | LAMP stack with workspace-sharded MySQL | Large customers overwhelming single shards | Hardware limits on hot shards |
| Notion | Postgres monolith, later 32 shards | 90%+ CPU, stalled VACUUM process | TXID wraparound risk, potential write outage |
| Checkly | Standard web app with Postgres | Missing composite index | Query time increased from 100ms to 1s |
These bottlenecks forced teams to conduct rigorous baseline tests to measure system stress and identify weak points.
Performance Baseline Testing
To tackle these challenges, teams used targeted monitoring and load testing to establish performance baselines. Notion tracked metrics like CPU utilization, disk IOPS, and replication lag across their 32 shards. They consistently observed CPU peaks exceeding 90% during high-traffic periods [3].
Slack measured baseline performance at 2.3 million queries per second, with a median query latency of 2ms and a p99 latency of 11ms [7]. When p99 latency began climbing above this threshold, it signaled that specific shards were under strain. They used per-shard metrics to pinpoint which enterprise customers were causing these "hot spots."
Checkly leveraged Postgres’s built-in diagnostics to identify slow queries consuming excessive execution time. Running EXPLAIN ANALYZE on the problematic query revealed that the database was performing a sort operation instead of using an index [10]. This insight allowed them to optimize the query effectively.
Load testing tools like Locust and JMeter also played a critical role. For instance, one e-commerce platform simulated 50,000 concurrent users ahead of Black Friday. This stress test revealed an 8-second database query under load. By addressing this bottleneck and adding read replicas, they successfully handled a 5x traffic surge without any downtime [11]. Considering that downtime costs SaaS companies an average of $5,600 per minute - and that 57% of users abandon an app after just one bad experience - such tests are invaluable [11].
Scaling Strategy and Zero-Downtime Deployment
Once teams identified their bottlenecks, they devised strategies to scale their infrastructure, databases, and deployment processes - all while ensuring uninterrupted service.
Infrastructure and Application Improvements
The first move was to distribute workloads across more machines. For instance, Notion expanded its Postgres fleet from 32 to 96 instances in July 2023. This adjustment addressed traffic spikes that had pushed CPU usage past 90%. To prevent proxy overload, they also partitioned their PgBouncer cluster into four groups [3].
Meanwhile, Gadget.dev introduced a "maintenance mode" in September 2025, leveraging Postgres advisory locks. This allowed them to briefly pause traffic - just 250 milliseconds on average - so they could update shard mappings without users noticing. As Harry Brundage put it:
"We required our own strategies to build revenue-generating apps and scale horizontally... without any downtime or dropped requests" [1].
Abnormal AI faced challenges with its Python/Celery setup, which couldn’t keep up with growing demand. In response, engineers De Sheng Chuan and Yang Ang transitioned to Golang and Kafka in September 2022. They employed a five-stage rollout that included traffic mirroring and feature flags. This approach increased capacity from 200 to 1,000 queries per second (a 100× improvement) and cut message processing time by 16%, all without any disruptions to customers [12].
Database Scaling and Optimization
After addressing infrastructure issues, teams turned their attention to database scaling. Horizontal sharding became a go-to method for scaling databases. For example, Stripe managed to migrate 1.5 petabytes of data across its MongoDB shards in 2023, consolidating underutilized databases and reducing the shard count by 75%. Remarkably, they maintained 99.999% uptime throughout the process [5].
Postgres logical replication proved to be a key tool for zero-downtime migrations. In December 2023, Knock used this method to upgrade from Postgres 11.9 to 15.3. They added tables incrementally to avoid suppressing AUTOVACUUM and the risk of transaction ID wraparound. One engineer remarked:
"The more data you have, the longer the upgrade will take" [2].
Notion refined its replication process by skipping index creation during the initial data copy, slashing synchronization time from three days to just 12 hours. To ensure data integrity, they ran "dark reads" (parallel queries to a new follower database) before the final switchover. They also monitored replication lag closely, tracking the Log Sequence Number (LSN) to confirm the target database was fully synchronized before redirecting production traffic [3] [14].
Intercom tackled disk I/O bottlenecks by migrating from Amazon Aurora's EBS storage to PlanetScale Metal with locally attached NVMe drives in mid-2024. This upgrade resolved tail latency issues and slashed hourly database costs by more than 60%. For high-demand queries, they introduced Vitess materialized views, which improved performance by over 90% [4].
Stripe further enhanced write throughput by optimizing bulk data ingestion. By sorting data based on common B-tree index attributes before insertion, they aligned writes with the database's internal structure, achieving a 10× increase in throughput [5].
Zero-Downtime Deployment Methods
Once databases were optimized, teams fine-tuned their deployment strategies to ensure seamless updates. Deployment methods varied depending on risk tolerance and resources. Blue-green deployments maintained two identical environments, allowing for instant rollbacks but requiring double the infrastructure. Rolling deployments updated instances incrementally, while canary deployments started by routing a small percentage of traffic to the new version to identify issues early [12] [13].
Stripe introduced a "traffic switch protocol" during database migrations. By attaching versioned tokens to each request, they ensured that database shards only processed requests with tokens newer than their known version. This approach eliminated conflicting writes and completed the cutover in under two seconds [5].
Abnormal Security adopted a five-stage rollout for its architecture migration. They began by mirroring traffic volume and requests, then compared metrics before gradually transitioning production traffic. Reflecting on their approach, the team noted:
"Failing to plan is planning to fail" [12].
sbb-itb-c336128
Monitoring and Incident Response
After scaling, teams needed real-time insights into system performance to catch and address issues before they impacted users. This required reliable monitoring tools and alert systems, forming the backbone of effective incident management and ongoing improvements.
Monitoring and Observability Tools
To keep systems running smoothly, teams leaned on tools like Prometheus for metrics and Datadog for observability. For example, Cloudflare operates a staggering 916 Prometheus instances, managing around 4.9 billion time series data points [15]. Meanwhile, Go1 adopted Datadog APM in early 2021, spearheaded by Executive VP Jon Ducrou. This move transformed their back-end visibility and drastically reduced outages - from weekly interruptions to only two incidents in six months [16]. Ducrou explained:
"Datadog's APM was the start of getting away from a world of hurt. It has given us observability as we scale, aggregating data by looking at our back-end infrastructure stack" [16].
For tackling distributed tracing challenges, OpenTelemetry became the go-to solution. Checkly, for instance, used it to solve a puzzling re-authentication issue in the AWS SDK. By caching security tokens locally, they shaved 40ms off latency, saving an impressive 2,777 hours monthly across 250 million checks [17]. On the extreme end of scale, Dropbox built a custom solution called Vortex, capable of handling 600 million metrics per minute, improving query speed by up to 10,000× in specific cases [19].
SLOs and Incident Management
To ensure their monitoring efforts aligned with user needs, teams focused on customer impact when defining Service Level Objectives (SLOs). Zendesk’s SVP of Engineering, Jason Smale, shifted to measuring "seamless service availability", which included third-party provider failures, like those from AWS or Cloudflare. They set a 99.95% SLO - allowing just 21 minutes and 54 seconds of downtime per month - and tied it directly to SEV1 incident definitions [21]. As Smale put it:
"Our customers don't care if we run the service that fails, or a vendor we use runs the service that fails. They care that they can't use Zendesk to do their job" [21].
To avoid overwhelming teams with alerts, Cloudflare developed pint, an open-source Prometheus rule linter that checks monitoring rules against live servers. This tool prevented errors like typos or missing metrics that could lead to monitoring gaps [18]. Go1’s proactive monitoring approach paid off, cutting critical incidents from 0.8 to 0.15 per developer annually and slashing bug resolution time from 92 days to just 19 [16].
But monitoring and incident response were just one part of the equation. Performance testing played a crucial role in ensuring these systems could handle stress.
Performance Testing and Optimization Process
To validate their SLOs under pressure, teams conducted gameday testing. In March 2024, FireHydrant simulated failures of their primary monolith and the us-east-2 region. By promoting database replicas and cycling Kubernetes pods, they achieved an impressive 99.99% uptime SLO and sped up alert delivery by 47× [20]. Team member Danielle Leong highlighted their focus:
"Our goal isn't to simply run without error, it's to be lightning fast" [20].
Automated testing pipelines also became a key part of the process, integrating performance validation to cut release cycle times by up to 40% [22]. Tools like ClackyAI (https://clacky.ai) helped developers quickly spot performance bottlenecks and generate optimized code during the build phase. By catching regressions early, teams maintained strong performance even as they scaled. These efforts not only ensured uptime but also reinforced the robust architecture established earlier.
Results, Lessons Learned, and Implementation Guide
SaaS Scaling Results: Before vs After Performance Metrics
Measured Results and Business Impact
The data speaks volumes. In January 2025, digital agency Clock celebrated 12 months of uninterrupted uptime after streamlining their infrastructure with Northflank. Over the course of a year, they executed more than 30,000 deployments, scaled to over 250 containers, and handled upwards of 20,000 requests per second. They also slashed environment provisioning time from weeks to just a few hours[23]. As Summers aptly remarked:
"We've gone from infrastructure being a constant headache to it being invisible. That's the highest compliment I can give." [23]
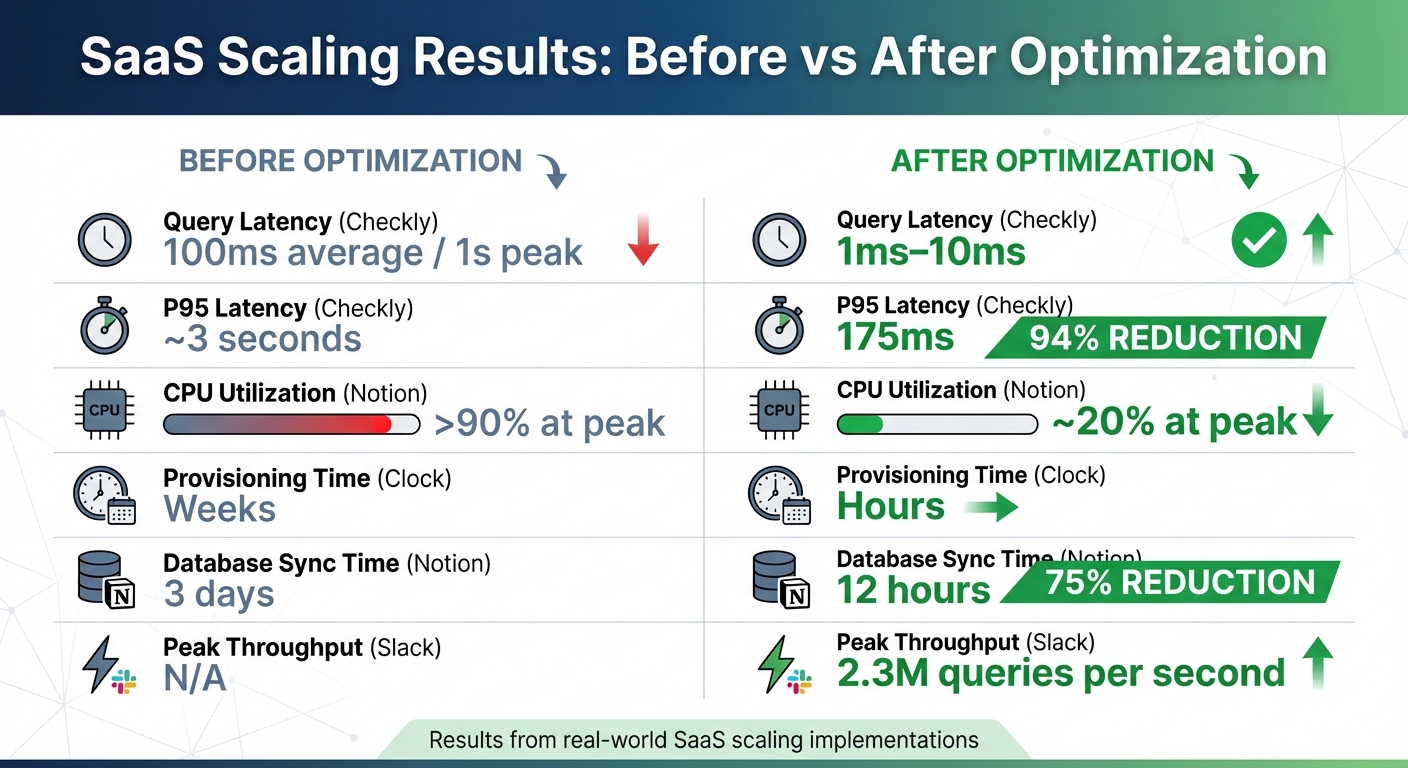
In July 2023, Notion completed a horizontal resharding project that delivered equally striking results. By tripling their Postgres fleet from 32 to 96 machines, the team, led by infrastructure engineer Arka Ganguli, reduced peak CPU and IOPS utilization from over 90% to about 20%. They also cut database synchronization time from three days to just 12 hours[3]. At Checkly, Chief Evangelist Tim Nolet introduced a composite index that brought query response times down from 100ms to just 1ms, with P95 latency dropping from 3 seconds to 175ms[10]. Meanwhile, Slack hit 2.3 million queries per second at peak, with a median latency of just 2ms, after moving to Vitess[7].
These results highlight the impressive outcomes that can be achieved by making thoughtful scaling decisions.
Tradeoffs and Decision Rationale
Every scaling decision comes with tradeoffs. For Notion, horizontal resharding was chosen over vertical scaling to avoid hardware limitations. Horizontal scaling allowed them to fine-tune individual instances to better handle varying traffic patterns, as Ganguli explained[3]. Intercom, on the other hand, opted to move from self-managed Aurora to PlanetScale Metal, prioritizing cost and performance gains over maintaining internal operational expertise. This decision resulted in a 60%+ cost reduction and a 90%+ improvement in query performance[4].
Slack adopted a cellular architecture, where services are isolated within Availability Zones (AZs). While this added complexity at the edge load balancer level, it enabled the team, led by Senior Staff Engineer Cooper Bethea, to implement AZ Draining. This system allows traffic to be rerouted away from a failing zone in under five minutes, ensuring users experience no visible interruptions[8]. For Knock, upgrading Postgres from version 11.9 to 15.3 required managing the complexity of logical replication to achieve zero downtime. This approach was chosen over a simpler in-place upgrade, which would have caused significant downtime[2].
Each of these decisions reflects a careful balance between performance, risk, and the need for continuous availability.
Step-by-Step Scaling Guide
To achieve similar results, start with data synchronization. Begin by performing bulk imports without indexes, then rebuild the indexes after the data transfer is complete[3]. Use logical replication or Change Data Capture to ensure the new infrastructure stays in sync with the production environment in real time. Before making the final switch, run "dark reads" by issuing parallel queries to both the new and old systems to confirm data consistency[3].
When shifting traffic, take it slow - start with just 1% to test stability[8]. For the final cutover, use a proxy layer to briefly pause traffic, allowing active queries to finish before updating the routing[3]. During the transition, enable reverse replication from the new system back to the old one. This provides a safety net, allowing for an immediate rollback if needed[3].
Tools like ClackyAI can be invaluable during this process. They can help generate optimized database schemas and migration scripts, identifying potential bottlenecks early and ensuring a smoother transition.
Conduct a "pre-mortem" ahead of the migration. Identify potential failure points, rank them by severity, and develop mitigation strategies for each[24]. When performing bulk loads, sort records by shared index attributes to boost throughput by up to 10×[5]. Finally, set up monitoring tools to track critical metrics like replication lag, API response times, and transaction IDs. This ensures you’ll know exactly when it’s safe to proceed[24].
| Metric | Before Optimization | After Optimization |
|---|---|---|
| Query Latency (Checkly) | 100ms avg / 1s peak | 1ms–10ms |
| P95 Latency (Checkly) | ~3 seconds | 175ms |
| CPU Utilization (Notion) | >90% at peak | ~20% at peak |
| Provisioning Time (Clock) | Weeks | Hours |
| Database Sync (Notion) | 3 days | 12 hours |
| Peak Throughput (Slack) | N/A | 2.3M QPS |
Conclusion
Scaling systems without downtime demands careful planning, constant monitoring, and a methodical approach. Companies like Notion, Knock, Intercom, and Slack all relied on a similar strategy: pinpoint risks early, test extensively, and shift traffic gradually. As Knock aptly put it:
"Without timely metrics, you're flying blind." [2]
These strategies provided invaluable lessons during high-stakes migrations. Intercom’s experience highlighted that scaling under pressure can be slow, costly, and disruptive [4]. To counter these challenges, successful teams implemented safeguards like reverse replication and rollback checkpoints before initiating migrations. They also tackled bottlenecks across the stack by sharding not just databases but also connection poolers and proxy layers [3].
Incremental migration emerged as a critical tactic. Adding tables to replication step by step and employing versioned gating helped prevent major failures [2][5]. Notion’s infrastructure team emphasized this approach, stating:
"We designed the process to not require downtime, keeping Notion up for an ever-more-global Notion community." [3]
This step-by-step method, championed by Notion and others, underscores the article’s central theme: reducing risks while scaling. These successes were rooted in systematic preparation and ongoing monitoring.
For teams embarking on similar migrations, leveraging tools like ClackyAI can streamline the process by creating optimized schemas and migration scripts. The key takeaways? Test thoroughly, monitor continuously, and avoid rushing the cutover. As Intercom noted after completing their migration:
"We've been upgrading databases every couple of weeks, and no one has even noticed. That's exactly how it should be." [4]
FAQs
How can you scale a SaaS app without experiencing downtime?
Scaling a SaaS app without interruptions takes a mix of smart strategies and precise execution. Techniques like rolling or blue-green deployments allow you to push updates without disrupting users, while methods such as logical replication or re-sharding make live database upgrades smoother. Another effective approach is incremental migration with traffic splitting, which lets you gradually shift users to new systems, reducing the chance of hiccups.
Automated solutions, like horizontal scaling, are great for handling sudden spikes in demand. But don’t skip the essentials: thorough pre-migration testing, real-time monitoring, and well-planned cut-over steps are critical to keeping risks low. Tools like ClackyAI can also simplify the process by offering key resources to help you deploy and iterate on your software effectively.
How do companies like Notion and Slack scale their databases without downtime?
To tackle database scaling challenges without causing downtime, companies like Notion and Slack use a combination of horizontal sharding and real-time monitoring. These methods help them spread data across multiple smaller databases, ensuring smooth performance even as user traffic increases.
Notion moved from relying on a single PostgreSQL instance to adopting a sharded architecture with Amazon RDS. By dividing their database into smaller shards, they resolved issues like CPU spikes and lengthy maintenance delays. The transition was carried out with a zero-downtime failover, keeping their service uninterrupted for users. They also utilize real-time monitoring tools, such as pganalyze, to pinpoint bottlenecks and adjust capacity when needed.
Slack faced similar scaling challenges with its MySQL-based databases but opted for Vitess, a sharding middleware. Vitess makes scaling easier by directing traffic to the correct shards while maintaining a unified database view for the application. This setup allows Slack to expand capacity, implement schema changes, and migrate data - all without affecting the user experience.
Both Notion and Slack demonstrate how sharding, automated failovers, and performance monitoring can effectively scale databases while preserving uptime and delivering a seamless experience for users.
How do monitoring and performance testing help ensure zero-downtime scaling for SaaS apps?
Monitoring is essential for scaling because it delivers real-time data on critical metrics like latency, traffic, errors, and system saturation. With this information, teams can spot and resolve problems swiftly, often before users even notice something is wrong.
Performance testing, including load and stress tests, complements monitoring by simulating heavy traffic scenarios. These tests help pinpoint bottlenecks and confirm that scaling adjustments can manage higher demand without causing disruptions. Combined, these strategies ensure your app scales smoothly while keeping performance and reliability intact.